Participatory Science Project
King Tide Monitoring Project
overview
TownGreen invites community members to take part in our King Tide Monitoring Project for Cape Ann — a participatory science effort to document the highest annual tides and better understand how rising sea levels are shaping our coast.
By capturing images of king tides at key coastal sites, we can create a powerful visual record that helps inform local planning and resilience efforts.
What is a King Tide?
A king tide is a naturally occurring event when the gravitational pull from the alignment of the Earth, moon, and sun creates the highest and lowest tides of the year.
For Cape Ann, these tides typically occur in October or November, with additional high spring tides appearing in March through May.
The Highest Astronomical Tide (HAT) ever recorded on Cape Ann reached 12.02 feet at the Essex River station on November 16, 2016 — a benchmark used to compare future tides and measure sea level changes.
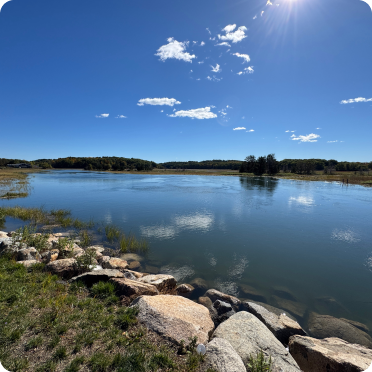
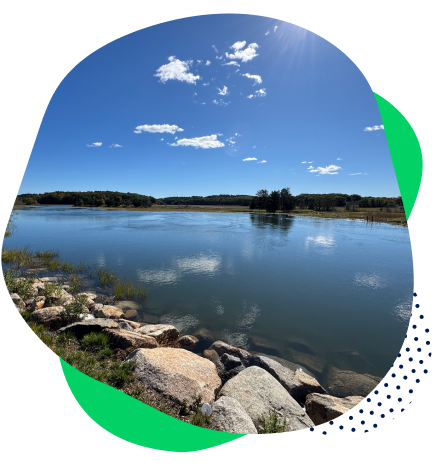
CZM MyCoast app: King Tide
Essex River Station
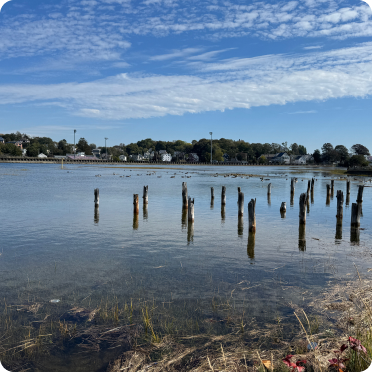
CZM MyCoast app: King Tide
Gloucester
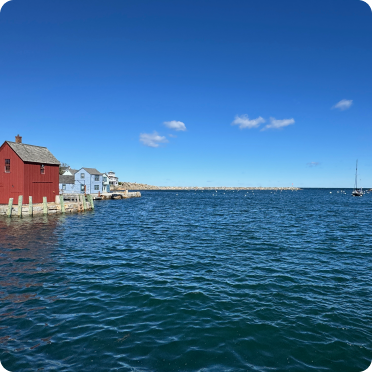
CZM MyCoast app: King Tide
Rockport Harbor
Why It Matters
As sea levels rise, king tides offer a preview of our future shoreline. Documenting these events helps Cape Ann communities visualize coastal change and plan for climate resilience.
Photos paired with tide data from NOAA’s measurement stations — located in Essex River, Gloucester Harbor, Rockport Harbor, and Lobster Cove — provide valuable evidence for state and local agencies as they evaluate flooding risks and plan adaptation strategies.
Your participation contributes directly to this growing community dataset, ensuring that Cape Ann is well represented in the regional record.
How to Participate
Join TownGreen as a King Tide Monitor and help capture this year’s highest tide event:
Join TownGreen as a King Tide Monitor and help capture this year’s highest tide event:
- Visit one of the designated Cape Ann monitoring locations. We are asking interested participants to take photographs of this event around Cape Ann, such as low-lying roads and in neighborhoods, particularly at places that correspond to some NOAA water level monitor locations:
- Essex River on the 133 Causeway
- Gloucester Harbor at Harbor Cove
- Rockport Harbor on T-Wharf and Bearskin Neck
- Lobster Cove, Annisquam Footbridge
- Manchester-by-the-Sea Harbor behind Town Hall
- Use the MyCoast: Massachusetts app or website to upload your photographs.
- Include brief notes about your location and conditions when you submit your photos.
All submissions are collected in the MyCoast: Massachusetts database, managed by the Office of Coastal Zone Management, where they become part of a statewide effort to document coastal change.
Get Involved
Interested in helping document Cape Ann’s changing coast?
Complete the short form below to sign up as a King Tide Monitor.
We’ll send updates, reminders, and site details as the event approaches.
Climate change is local.
Your donation to TownGreen will support Cape Ann climate action and education